Showing posts with label how to. Show all posts

Harry Potter and the Tableau School of Word Clouds and Data Vizardry

What is a word cloud?

Oh, yes, that's when I take a big bite of alphabet soup and then spit it out because it's way too hot, right? No... no, not really. No. Not at all, actually. A word cloud provides a visual representation of text data where unique words are arranged in shape or clustered together and sized by their number of occurrences or importance. The viewer of a word cloud should gain a quick understanding of how many unique words exist in the text data, quickly pull out important words and see what categories may exist among the unique words.

Word clouds are a form of data visualization. They have been used since the 1990's as a means of site navigation for keyword metadata (tag clouds) to help people find the pages they're searching for on a website. Today, word clouds have been popularized to include any form of text data and there are many websites that provide word cloud services. What I found after looking through most of the word cloud websites is that the output is typically delivered in static form. In my words, "I have all this cool text data, but all I get from it is a lousy static picture?!?" Maybe that works for most people, but I want more from my text data.

Let's say I got my hands on some pretty cool text, or rather, "the most freaking amazing text," by my wife's standards. That's right, I have "Harry Potter and the Chamber of Secrets," from the 2nd novel in the 7 novel series, Harry Potter, written by the wonderful JK Rowling, in a text file. And let's also say I wanted to turn that text data into a word cloud to help me see what unique words are used and which of those unique words are used the most throughout the story. I could easily go to one of the top searched word cloud sites and create one for free, if only for this purpose.

Heck, I could even go to another top searched word cloud site and create one that removes any of the commonly used words and punctuation marks in the English language e.g. and, is, so, him, should, ?, !, (, ), etc. These are called "stop words." Some word cloud websites provide the option to choose which words or characters to suppress in a word cloud so that the word "the" isn't taking up half the word cloud like in the image above. Now, in the image below, it can be seen that the most used word throughout the book is clearly "Harry" with "Ron" and "Hermione" trailing behind.

But these are only static images and my options for what I can do with the word cloud are limited. What if I had more questions that I needed my word cloud to address? What if I needed my word cloud to be interactive? What if I wanted to host my word cloud online so that others could interact with it?

To solve these problems, I turned to Tableau.

But first I had to get a dataset, which was essentially an entire book in the form of a text file, shaped and ready to go in Tableau. For that, I busted out my wizarding wand and used some notepad++ magic along with a keen eye as I parsed out the data. What I wanted my data to ultimately look like was a 2 column table. One column would contain all the words used in the book and the other column would contain the sequence of each word used throughout the book. I also made all words lowercase so they'd be easier to read in the word cloud.

Once I had the data prepped and saved as a text file, I plugged the data into Tableau and built my first word cloud. As can be seen below, this word cloud displays all unique words or characters contained in the file, except for any unique word or character occurring less than 10 times. I figured any word occurring less than 10 times may either be a corrupt word or one that just isn't very interesting or relevant to the story - it also helps dashboard performance. Each word is sized and color-categorized according to its number of occurrences throughout the book. I've provided a way to filter the quantity of unique words displayed in the word cloud by a minimum and maximum number of occurrences. I've also enabled a word search function where one or more words can be shown while filtering out all non-matching words from the visualization.


If I go back to my data connection and left join my own, custom made Stop Words data set to it, I can easily filter out any of the commonly used words I do not want to see in my word cloud. Here, we can see that words like "the" which occurs 4,092 times throughout the book, is filtered out, along with other commonly used stop words like [and, in, a, his, of, said, he, to, etc.] while the newly reigning word featherweight champion of the book now clearly becomes "harry." This word cloud has the same ability to filter, search, and easily see the word occurrence groups.


Ok, great, I built an interactive word cloud. What about all those other questions I have? Building a word cloud dashboard would allow me to take advantage of the unique words and also the word sequencing that I have built into my text data through additional visualizations and dashboard actions. This is helpful because a word cloud is not typically the best data visualization to use if I want real insights from my data, so the dashboard below provides 3 additional views to the word cloud:

  1. A word bubble (Word Bubble! at bottom left) easily helps me get a sense of the quantity of each unique word in a given word occurrence group.
  2. A vertical bar chart (Words Used per Chapter at bottom middle) helps break down each chapter by the unique words contained within it.
  3. A horizontal bar chart (Most Used Words at bottom right) quickly shows words having the most to least occurrences.



And when these 3 additional views accompany the word cloud, I can now apply dashboard actions to click on different data points and answer questions like:

How often, per chapter, does the word Harry occur compared to all other words in the chapter? In fact, Harry appears throughout the book more than the total count of unique, relevant words in most of the chapters.


What chapters feature Ron, Hermione, or even the adorable little Dobby? If I click on Dobby, I'll see he is featured in chapter 2, chapter 10, and of course chapter 18 when (spoiler alert) "Master has given a sock... Master gave it to Dobby... Got a sock. Master threw it, and Dobby caught it, and Dobby - Dobby is freeeeeeeee."


What chapters feature certain creatures or events? Click any data point and take a look at the "Words Used per Chapter" chart to find out which chapters heavily feature certain words. I can even type a word in the "search for a particular word" filter to more clearly see which chapters feature words like "spider" (chapter 15) ...


...or which chapters are filled with "quidditch" action (chapters 7 and 10).


Very magical stuff, indeed! If you have a great example of a word cloud dashboard that you'd like to share or if you have any questions or feedback, feel free to comment below.

Tableau Table Calcs: How to Calculate a Year-Over-Year 4 Week Moving Average

Last week, a co-worker asked if I could help her out with a Tableau table calculation. Her goal was to come up with a year-over-year (YoY) percent difference of the 4 week moving average for some key metrics in her data set. Tableau easily allowed her to find the key components individually, but she was having difficulty combining the YoY %Diff with the 4 week moving average. I'd like to share how I thought through the problem and worked it out with table calcs.

First, it's important to understand what table calculations are... from Tableau's website:

"A table calculation is a transformation you apply to the values in a visualization. Table calculations are a special type of calculated field that computes on the local data in Tableau. They are calculated based on what is currently in the visualization and do not consider any measures or dimensions that are filtered out of the visualization."

The "table" refers to the data table I create in Tableau by pulling in dimensions and measures into the rows and columns shelves. The physical data table is all that I have to work with, so any values I'd like to use for a table calculation better be represented somewhere on my table! One of the neat things about this is that data can be aggregated or calculated prior to being populated in the table, and then that pre-aggregated or calculated data can be used for additional calculations. Some of the most common applications of table calculations include percent differences, running totals, weighted averages, etc.

Knowing I need all my data laid out on the table in order to use a table calc, I start with populating my data table with something like sales (measure) by date (dimension). For the purpose of this exercise, the date dimension contains dates from every Sunday of the week.

Essentially, on my data table, what I want to start with are the weekly sales figures for each Sunday. I drag my date dimension onto the rows shelf as a discrete, exact date. I then drag my sales measure onto the text mark.


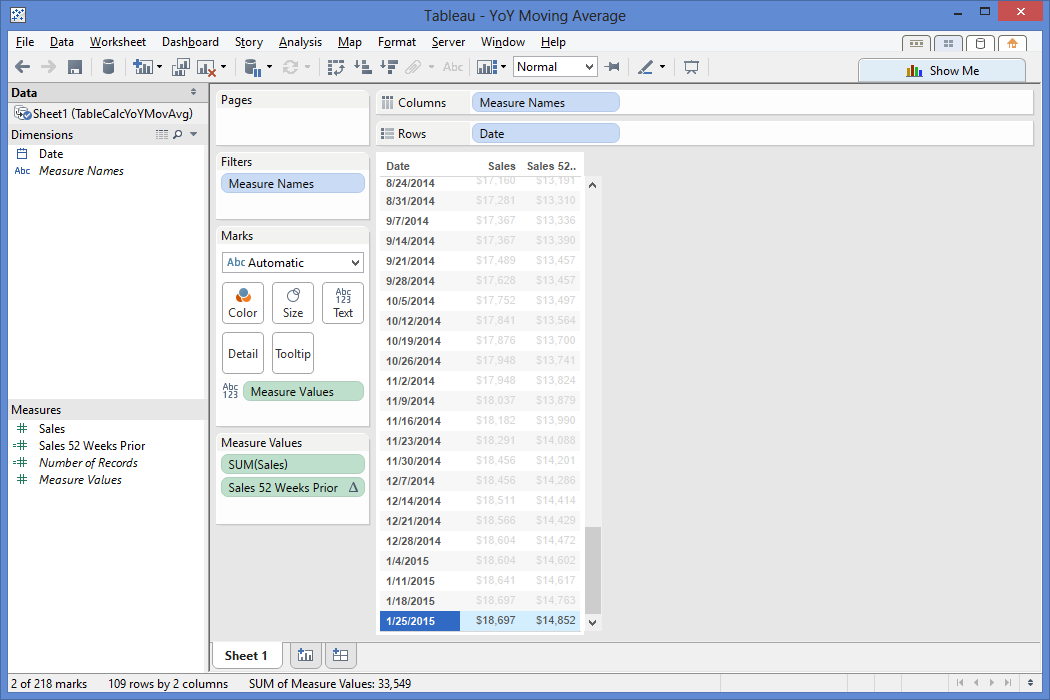
Now that I have my data laid out the way I want it, I start piecing together the steps I'll need to take to get to my final solution. First, I know I'll need to be looking a year back in my data, so I want to figure out the calculation that gets me a data point from 52 weeks back from a given row. Essentially, I want to bring the sales value from 1/26/14 ($14,852) down to the same row as my 1/25/15 sales value ($18,697). To do this, I know I need the sum of sales. I also need a way to handle NULL sales values, so I employ the ZN() function to handle NULL values as 0. Then I insert the ZN(Sum(Sales)) as the expression of the LOOKUP() and use an offset of -52, since I need to look 52 values back in my weekly date to find last year's weekly sales value.


I double click my "Sales 52 Weeks Prior" pill in the measures shelf to add it to my data table, then check if my 1/26/14 value is now showing as the 1/25/15 sales value.


It checks out! The next calculation I need is to find the 4 week moving average. I right click on the Sales pill in my Measure Values and create a table calculation. I select the Moving Calculation, summarize values using the average, moving down along the table since my dates are sorted ascending, and then look 3 values back from the current value.


One thing to point out here is that I could click "Perform a secondary calculation on the result" as seen in the below image but Tableau does not provide an option for a custom number of values to look back on, which is a big part of why I'm writing this post! I only have the previous, next, first, and last values as an option, and I need to specifically look 52 values back, so let me click out of this option and go back to the table calc above.


If I click the "Customize..." button, I can check out Tableau's automatically generated calculation based on my selections. This calculation takes the Window Average of my sales, starting 3 periods back from a given value, to the given value. I rename this calculation as the "Sales 4 Week Moving Average" to save it as a new calculated field in my measures shelf because I'll be using it again.


When I click OK, this calculation will now replace the sum(Sales) on my chart, so I go ahead and add sum(Sales) back to the table for reference. Does the moving average calculation average out the current plus last 3 weeks of sales data for a 4 week moving average? Yup!


So now what do I do? Well, let me start with what I have... I have my weekly sales, my sales from a year back, and my 4 week moving average. I now need to find a way to get my 4 week moving average from a year back.

I have an excellent head start for this, because I not only got my 4 week moving average calc working, but I also have the lookup logic to get a value from 52 weeks back. What I need to do is create a new calculation that combines the "Sales 4 Week Moving Average" logic [WINDOW_AVG(SUM([Sales]), -3, 0)] with my "Sales 52 Weeks Prior" logic [LOOKUP(zn(sum([Sales])),-52)].

This is precisely why I replace the sum([Sales]) logic in my 1 year lookback [LOOKUP(zn(sum([Sales])),-52)] with the 4 week moving average logic [WINDOW_AVG(SUM([Sales]), -3, 0)].


I add my new calculated measure "Sales 52 Weeks Prior 4 Week Moving Average" to the data table by double clicking its pill in the measures shelf. Does this show the 4 week moving average from 1 year ago on the current row? It sure does!


Now that I have the current 4 week moving average and the 4 week moving average from 52 weeks ago, I can create a calculation that takes the ( (current 4 week average) - (4 week average from 52 weeks ago) ) / (4 week average from 52 weeks ago) to find my year-over-year 4 week moving average.


( WINDOW_AVG(SUM([Sales]), -3, 0) - LOOKUP(zn(WINDOW_AVG(SUM([Sales]), -3, 0)),-52) )

/ LOOKUP(zn(WINDOW_AVG(SUM([Sales]), -3, 0)),-52)


I add this to the data table to check if works...


It works! I have just created a YoY %Diff using 4 week moving averages to show that my 1/25/15 4 week moving average is 26.86% more than the 4 week moving average from 52 weeks back! If I play around with the Show Me options, I can chart my YoY 4 week moving average against the 4 week moving average of sales as a line graph, or whatever type of visualization will help the end users make data-driven decisions.


A few gems for you to note that played an instrumental role in my ability to work through this table calc problem in Tableau:

  • Build out your base table first using dimensions and measures needed for analysis
  • Maintain a level of granularity needed for the table calcs i.e. having weekly data for a 4 week moving average calculation
  • Try to get any calculations needed on the given row it will impact i.e. bringing the 4 week moving sales average from 1/26/14 (52 weeks ago) to the row that displays 1/25/15 data
  • Create basic calculations first, then start piecing them together to achieve what you need i.e. embedding the 4 week moving average calc into the YoY calc
  • Be creative but think practically

Subscribe!

A few days ago, I was asked to elaborate on the capabilities and limitations of the subscription function within Tableau Server. Sure, Tableau's Online Help website has information on this subject, but I couldn't quite find everything I thought an end user would be interested in knowing in one happy place.

Some background information is that part of my job is to develop Tableau Dashboards, to do a little Server admin work, and to also demo any and all things Tableau-related. If you do any or all of the aforementioned, I think we can agree that it's important to utilize the full strength of Tableau desktop and server. But, in reality, a lot of Tableau's nifty features can get lost in a typical project. This is why I think it's important to package up as many of the cool/relevant features I can into the dashboard design itself, then demo all the extra cool "stuff" (i.e. subscriptions) the end user can do in order to create a greater sense of empowerment over the data and increase usage to drive better insights.

With that being said, this post is for you if you're:

  • developing a Tableau dashboard, publishing it to Server and would like your audience to receive your dashboard for updates
  • accessing Server to check out a few dashboards and would like to receive one or more on a regular basis
  • simply interested in a new (and super exciting) way to demo the subscription function of Tableau Server

Subscriptions allow the user to schedule an email to hit his/her inbox with an updated snapshot view of a dashboard, or even all dashboards in a workbook, that he/she would like to see on a regular basis without having to log into Tableau Server.

The subscription functionality was introduced as a new feature to Tableau Server during its v8.0 release around Q2 2013. No, this wasn't a groundbreaking innovation by Tableau, rather, a rapidly growing Tableau very wisely jumped on the subscription bandwagon. Tableau saw a large potential increase in users of Tableau Server, its means of spreading data to the masses. With many of these end users already comfortable with traditional BI tools scheduling canned reports to their respective inbox, Tableau added the subscription function to stay relevant and competitive with the plethora of BI tools already performing this task.

In an ideal world, all users log into Server to interact with the dashboards for rapid-fire insights. However, we all know a manager or two that refuses to use any technology other than their email and smart phone. This is where Tableau subscriptions come in handy; they help familiarize the typical "hands-off" user with the dashboard. And once that person starts bringing printouts of the dashboard to meetings and plugging it into PowerPoint presentations, it won't be long before the adoption curve has them logged into Server and interacting with the data - maybe even with their iPad!

Hopefully by now I've made my point as to why subscriptions can be a good thing and you now want to see a demo. Well, here's how a typical user would go about interacting with Tableau's subscription function...

Below is our "typical" dashboard view as it would appear on Server. Nothing fancy here, just a summary dashboard of some mocked up campaign performance data. Let's pretend the data presented in this dashboard is actually a live connection to a database that updates everyday at noon. We can already see some interesting data here, with performance trends and benchmarking, a top 10 chart, and a drill down chart that updates through dashboard actions. Anyone interested in viewing this information would be forced to log into our Server, find this view, and refresh it with the latest data.


At the top right, a (very small) mail icon appears next to the download link. What's interesting is that little mail icon is packed with power. Let's click on the mail icon and walk through the pop up window below... and feel free to click on the image to get a bigger view.

Step 1. Click to open subscription options.

Step 2. Check the destination email. We are able to change this. (I describe how in the "manage my subscriptions" section below)

Step 3. Edit the email subject to be something relevant. ("Overall Summary" works for me)

Step 4. Select the schedule for this dashboard to be sent. Options are controlled by the Tableau Administrator and can be customized.

Step 5. Select the content to be emailed - "This Sheet" sends only the sheet/tab/dashboard - "Sheets in Workbook" sends all dashboards within the workbook being viewed.


VoilĂ ! I have just successfully subscribed to the "Overall Summary" dashboard, with it scheduled to hit my email inbox everyday at 2:30pm. Interested in seeing what this might look like in a Microsoft Outlook inbox? Look no further...


A perfect dashboard view sitting in my inbox! Here, the email was sent by our default mail distributor we set up for our Tableau Server, called the BI Applications Team. The email was sent promptly to my inbox by 2:31pm, only 1 minute after the schedule should have began to run. If I click anywhere on the dashboard, it will bring me to the dashboard on Server, so I'd like to remind you now that this is a static, non-interactive view of the data. The benefit here is that it could be refreshed with live data if that's how the data connection is set up.

If there are tons of subscriptions the Server has to process during the same time, the Tableau Administrator is able to prioritize certain subscriptions over others to ensure key dashboards are hitting users' inboxes as soon as possible. Please work with your Admin if this is the case.

Now, let's scroll down to the bottom of the email and take a look...

What you should see is a link to "Manage my subscription settings." This comes in handy especially when you want to unsubscribe from the current dashboard, or change your subscription settings. Here's a look at what pops up on Tableau Server after you click the link and log in...

I've added in a red box to help highlight the area of focus.

  • I am free to edit the Subject of the email to be something more relevant to me.
  • I am also able to change the schedule of the email to a new option, for example I could change it to be weekly on Mondays at 9am. If I don't see an ideal option available, I can contact the Tableau Server administrator and see if he/she can include a better schedule for my dashboard.
  • I am also able to unsubscribe from my current subscription. If I click the unsubscribe button and then hit "Update," the subscription should disappear.

Oh, and one last thing, I can also update the email my subscription is delivered to in the "Change Email" section at the top of the page.

If I go back to the dashboard on Server, I'm free to create a custom view of the dashboard by clicking the filters that are most relevant to me, then saving the view to My Custom Views. For example, I clicked the "Circulation" option in the "Select a Metric to Analyze" filter and created the "Circulation" custom view below, then went through the subscription process for that view to have it hit my inbox instead of the standard view (which was originally "Demand").


Some points to call out with Tableau's subscription functionality are:

  • If there is a date filter set on the dashboard when it is published to Server, Tableau will not update the end date of that filter to reflect the current date. The only way I know how to handle this is to have someone edit the date in Tableau Desktop, then re-publish that dashboard to Server. I'd really like to see Tableau add an automatic end-date update function in the future.
  • If there are hidden tabs in a dashboard when it is published to Server, those tabs will not appear in the email subscription.
  • If there is a dashboard with many filter options, and the end user would like to see each of those filters, he/she would need to filter to each option and set a new subscription to his/her inbox.
  • Tableau does not support a wide variety of export options at the moment. Other tools allow for Excel, PDF, PowerPoint, etc. export options. Tableau only sends a PNG image hyper-linked to the dashboard view on Server.

If you have any other points I haven't called out here, please feel free to comment and I'll add it to the list. Thanks for reading!