Showing posts with label tableau. Show all posts

PELOTON

Anyone else secretly obsessed with Peloton and all the data they provide for working out?

Here's my custom Tableau dashboard I made utilizing DovOps Google App Script for handling/synchronizing my Peloton Data into Google Sheets and using Tableau Public's native web data connector to Google Sheets for automated updates. #GitHub #googlesheets

If you have any comments/questions or if there are any views you like/dislike, tweet me!

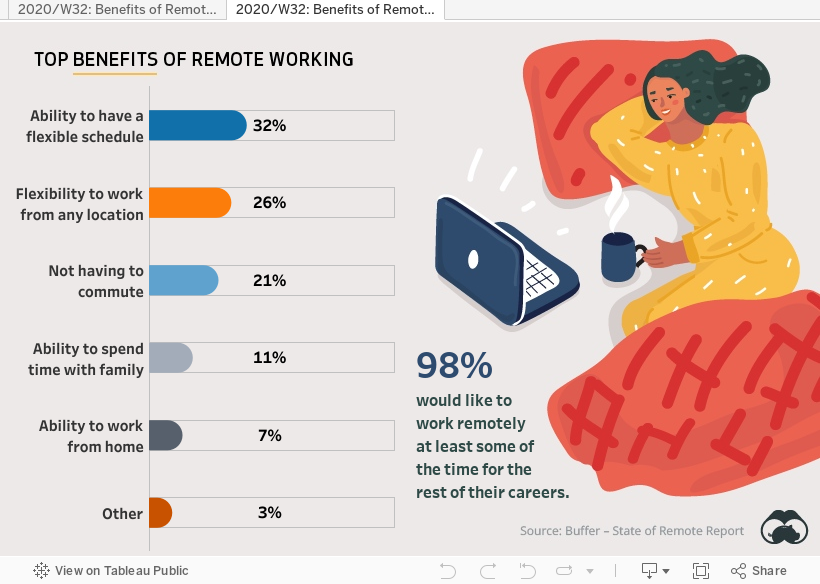
2020/W32: Benefits of Remote Work #makeovermonday

 In my first version, I converted the stacked bar into a donut chart generally not a best practice , using a color blind palette, and paired it with a table for easy consumption of the data.


I decided to make a second version, which I ended up liking a whole lot more because of how clean the rounded bar charts look.

IRON VIZ 2020 SUBMISSION: Good Night, Sleep Tight, Don't Let the COVID-19 Pandemic Bite

My Iron Viz submission for 2020: Good Night, Sleep Tight, Don't Let the COVID-19 Pandemic Bite

Mental Health #MakeoverMonday 2020 wk27

Bracket Challenge - Disney Songs

With my niece Evelyn turning 1 next week, we've been getting back into watching Disney movies and listening to Disney songs on Spotify, knowing that she'll get to experience them all for the very first time soon enough. That sparked a great debate... "What's the Best Disney Song Ever?"

To tackle this, we decided to send Cinderella to the Big Dance!

I put together a spreadsheet with our top 64 Disney songs and ranked them using Spotify play counts (or YouTube if not available on Spotify). I initially did this in Google Sheets because it was relatively easy to make a bracket there, but as a self-proclaimed "Tableau Wizard" I had to try it out in my favorite data viz application.

After...

  1. 63 set actions
  2. an image of a bracket I threw together in Excel and used as the background
  3. a heck of a lot of formatting and floating objects, and 
  4. a URL-action enabled song preview feature... 

It's now your turn to join in on the Big Dance and see if your favorite song is ready to have its own "Cinderella story" in my Tableau-enabled Bracket Challenge of Disney Songs.

Tweet at me or leave a comment to let me know what you think.

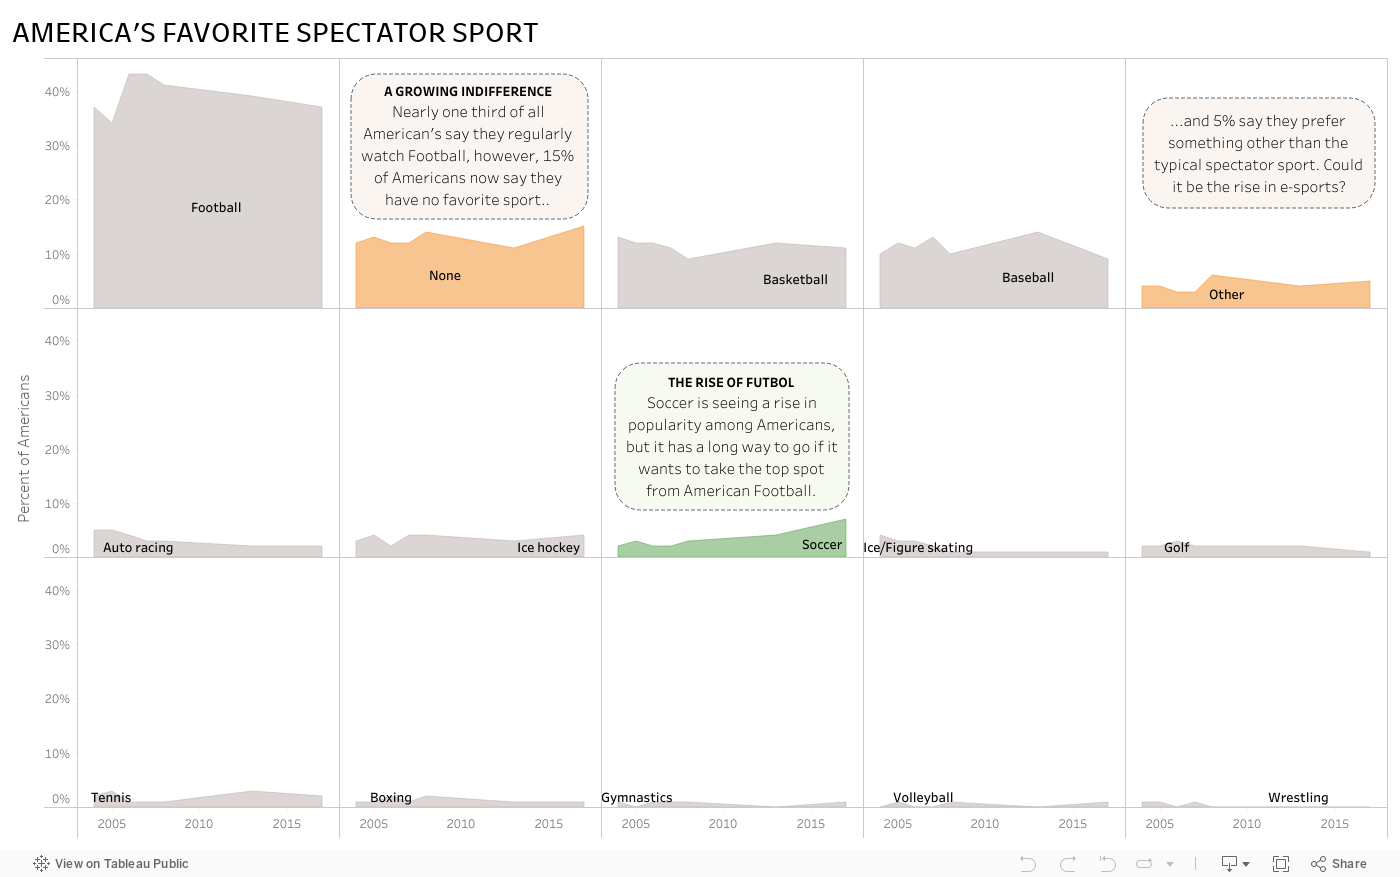
#MakeoverMonday - America's Favorite Spectator Sport

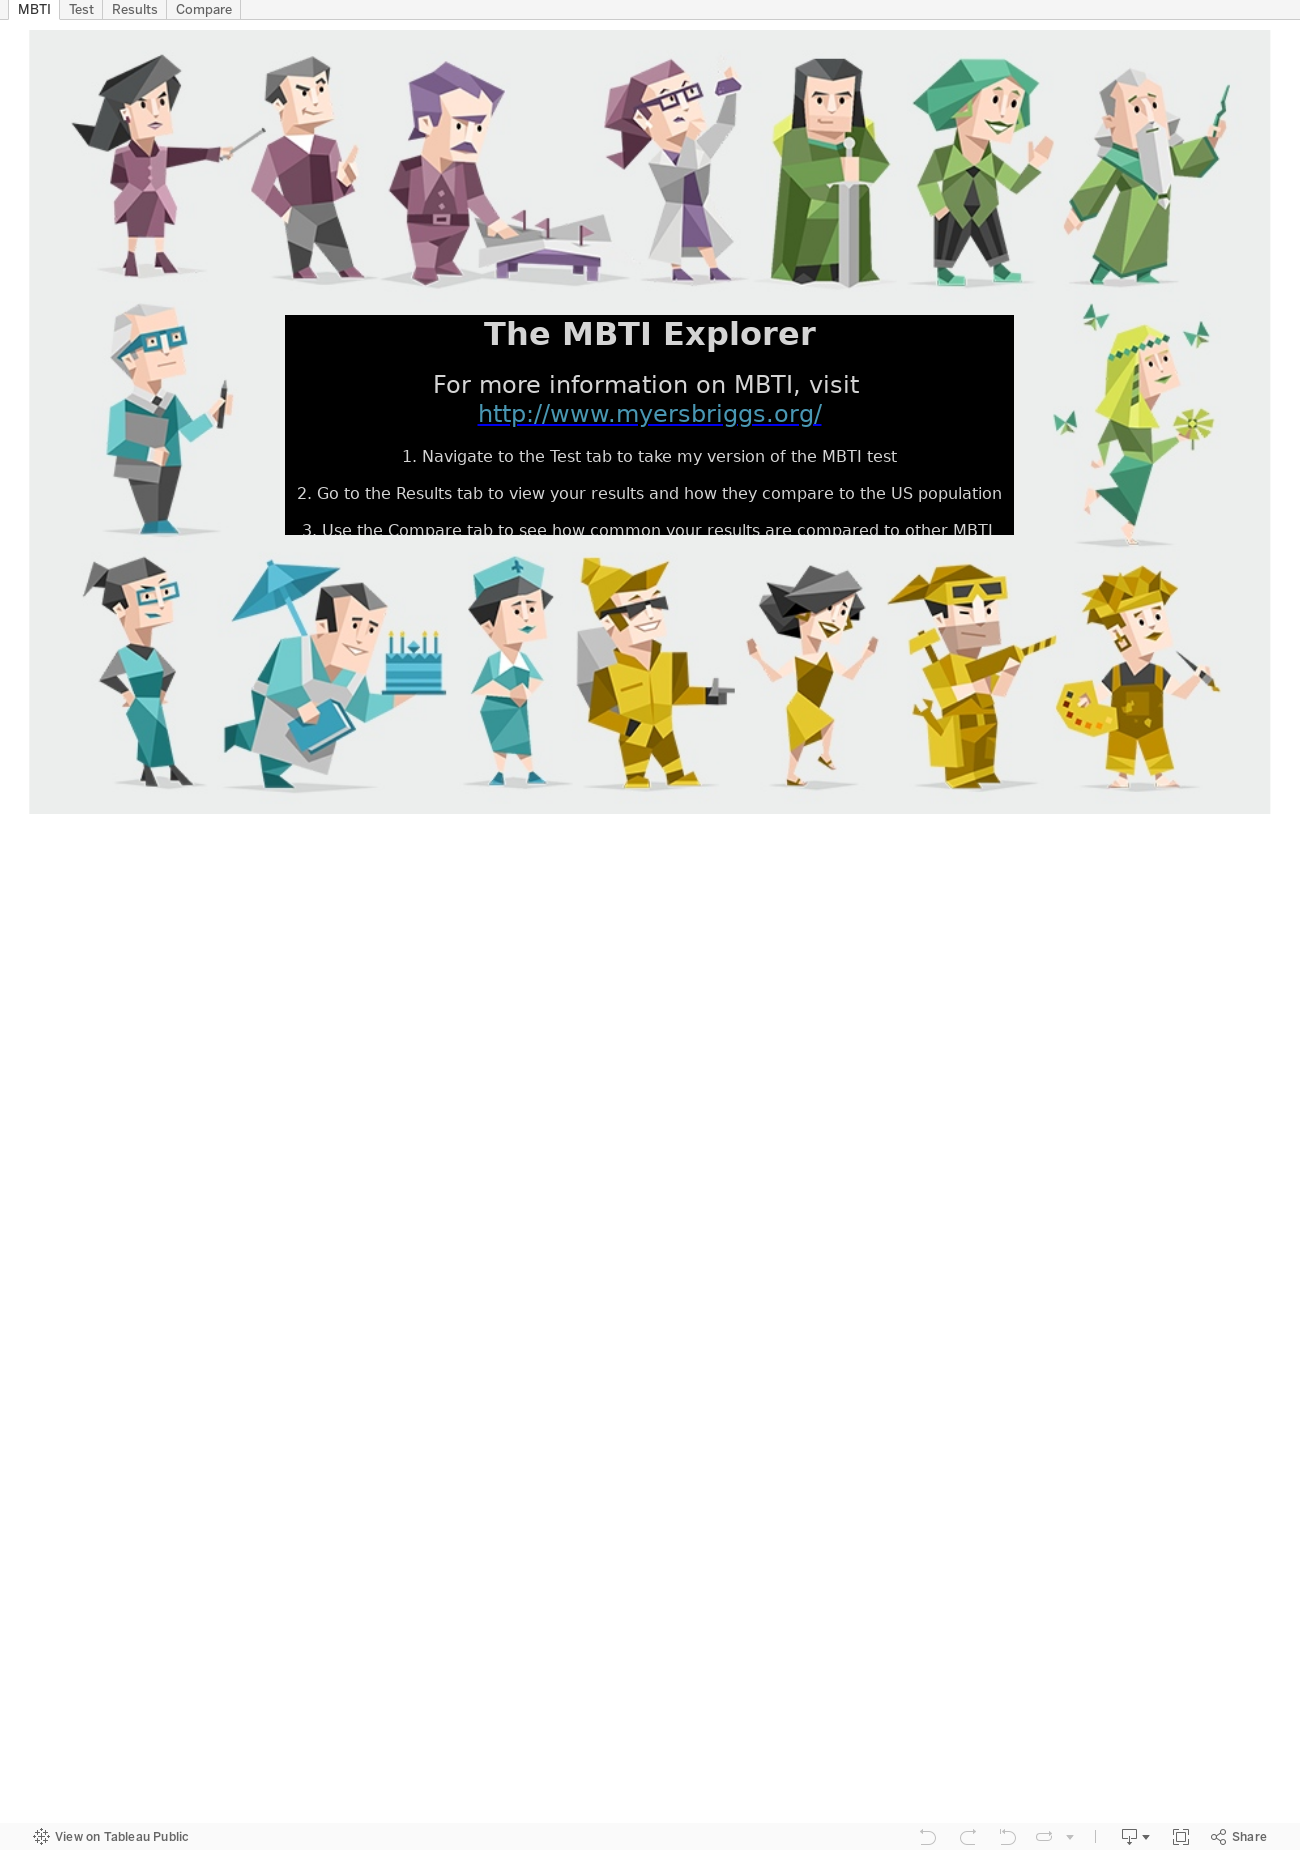
#MakeOverMonday - The MBTI Explorer

This week, it seems I did exactly what #MakeOverMonday tells me not to do and I went hog wild with my MBTI viz. I saw Andy Kriebel's entry over at his blog VizWiz and it got me thinking, "I'd like to see how my MBTI result stacks up in this view."

I created a make-shift test in Tableau based off the statements that define each of the types.

The users select a "Yes" or "No" answer based on whether they tend to agree that the statement applies to them or not.


Now for test results. Here's where I copied Andy a bit. I also added in a little indicator for how strong the users' test results lean in each type. Turns out I'm the type "INTP" as seen below.


To find out how common my type is against data from folks in the USA, I created a heat map. When the user clicks on the box that represents their personality type, it brings them to an external website to help them learn more about what their type means.


In the end, it was fun to use Tableau to act as a test form and show results from the test and analyze them all in one workbook.

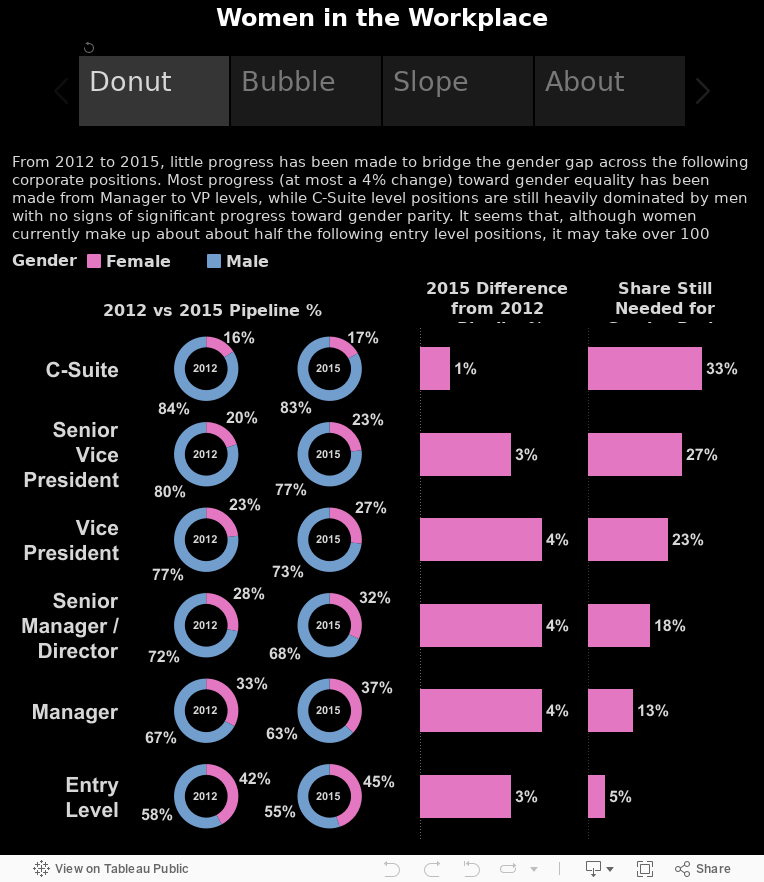
#MakeoverMonday Women in the Workplace

Here's my attempt at a tablet (specifically for the iPad) dashboard as part of the #MakeoverMonday viz challenge.

Contest rules here and original source here.

The dashboard was built at 764x855 pixels, which is Tableau's default pixel size for an iPad Portrait view. It works well in both the Tableau app and also through the Safari or Chrome browsers.

Like my #MakeoverMonday viz last week, I used story points to help condense a few different views of the data. I use each point to focus on a specific type of chart and allow the end user to absorb the same information in different ways. Please use the comments section to let me know which chart is your favorite (and why).

Enjoy!


Click here to follow the live action on #MakeoverMonday

#MakeoverMonday - Facebook's Path to Sustainability

Here's my attempt at a mobile (specifically for the iPhone 6) dashboard as part of the #MakeoverMonday viz challenge.

Contest rules here and original source here.

The dashboard was built at 320x568 pixels, which seems to work well even when browsing this dashboard on my mobile Safari browser.

I used story points to help condense a few different views of the data.

Enjoy!


Click here to follow the live action on #MakeoverMonday

My #MakeoverMonday Viz

The challenge this week for #MakeoverMonday is to rethink the Tableau viz included in the CNBC article, The Victims of the 21st-Century Slave Trade and use its data to help turn it into a more meaningful visualization. I spent a few minutes figuring out the data, which was fairly simple but slightly confusing as to what exactly it meant. After reading the article, I understood the data was focused on the "Bureau of International Labor Affairs (ILAB) reveal[ing] that more than 136 products from 74 countries are produced by forced and child labor. These are products used by consumers worldwide every day." With that in mind, I came up with 3 questions to explore...

  1. What does the distribution of countries, identified by the ILAB, look like geographically? For a given tier, are there clusters of countries within certain regions?
  2. Are things getting any better? What do trends look like for the number of countries identified per region per year? Are there hot spots?
  3. Which countries per region are the greatest offenders of the slave trade? What does this look like by tier?

I set out to make a few visuals, figured out a few that I liked, and aligned them on a dashboard making every data point actionable to the rest of the data presented. This all took me about an hour. Here's my viz:

Click here to follow the live action on #MakeoverMonday

Star Wars: A Film Review

Well this was fun!

Tableau Public recently put up some Star Wars data for us Tableau Jedi's to play with. Through Tableau's web data connector, I was able to connect to their Star Wars API and pull down some data, along with adding some of my own, to create a neat little Star Wars film review dashboard.

The idea here is to click on a film title, like A New Hope at the very top. After that's done, the poster for the selected film will appear along with the opening crawl that we all know and love from the Star Wars movies. This should provide a general sense of what's going on in the movie, so the next visualization covers the hottest words throughout the movie script. There must be a lot of action around words like "Luke" "Han"and "Death Star" in A New Hope! Now that we have an understanding of what the movie is all about, the next section at the bottom left deals with how 3 popular film critic sites have rated the movies. It's clear that Episode 4 is very popular, but it's also very well rated by Rotten Tomatoes, IMDB, and Metacritic.com. Finally, to understand why the movie is so popular, or unpopular as is the case with the first 3 movies, the star scatter plot on the bottom right shows who directed and produced it. It's pretty clear, after clicking around a bit, that movies produced by Rick McCallum tanked with the critics. So go ahead, click around, and get pumped for the amazing reviews The Force Awakens has already built up!

Harry Potter and the Tableau School of Word Clouds and Data Vizardry

What is a word cloud?

Oh, yes, that's when I take a big bite of alphabet soup and then spit it out because it's way too hot, right? No... no, not really. No. Not at all, actually. A word cloud provides a visual representation of text data where unique words are arranged in shape or clustered together and sized by their number of occurrences or importance. The viewer of a word cloud should gain a quick understanding of how many unique words exist in the text data, quickly pull out important words and see what categories may exist among the unique words.

Word clouds are a form of data visualization. They have been used since the 1990's as a means of site navigation for keyword metadata (tag clouds) to help people find the pages they're searching for on a website. Today, word clouds have been popularized to include any form of text data and there are many websites that provide word cloud services. What I found after looking through most of the word cloud websites is that the output is typically delivered in static form. In my words, "I have all this cool text data, but all I get from it is a lousy static picture?!?" Maybe that works for most people, but I want more from my text data.

Let's say I got my hands on some pretty cool text, or rather, "the most freaking amazing text," by my wife's standards. That's right, I have "Harry Potter and the Chamber of Secrets," from the 2nd novel in the 7 novel series, Harry Potter, written by the wonderful JK Rowling, in a text file. And let's also say I wanted to turn that text data into a word cloud to help me see what unique words are used and which of those unique words are used the most throughout the story. I could easily go to one of the top searched word cloud sites and create one for free, if only for this purpose.

Heck, I could even go to another top searched word cloud site and create one that removes any of the commonly used words and punctuation marks in the English language e.g. and, is, so, him, should, ?, !, (, ), etc. These are called "stop words." Some word cloud websites provide the option to choose which words or characters to suppress in a word cloud so that the word "the" isn't taking up half the word cloud like in the image above. Now, in the image below, it can be seen that the most used word throughout the book is clearly "Harry" with "Ron" and "Hermione" trailing behind.

But these are only static images and my options for what I can do with the word cloud are limited. What if I had more questions that I needed my word cloud to address? What if I needed my word cloud to be interactive? What if I wanted to host my word cloud online so that others could interact with it?

To solve these problems, I turned to Tableau.

But first I had to get a dataset, which was essentially an entire book in the form of a text file, shaped and ready to go in Tableau. For that, I busted out my wizarding wand and used some notepad++ magic along with a keen eye as I parsed out the data. What I wanted my data to ultimately look like was a 2 column table. One column would contain all the words used in the book and the other column would contain the sequence of each word used throughout the book. I also made all words lowercase so they'd be easier to read in the word cloud.

Once I had the data prepped and saved as a text file, I plugged the data into Tableau and built my first word cloud. As can be seen below, this word cloud displays all unique words or characters contained in the file, except for any unique word or character occurring less than 10 times. I figured any word occurring less than 10 times may either be a corrupt word or one that just isn't very interesting or relevant to the story - it also helps dashboard performance. Each word is sized and color-categorized according to its number of occurrences throughout the book. I've provided a way to filter the quantity of unique words displayed in the word cloud by a minimum and maximum number of occurrences. I've also enabled a word search function where one or more words can be shown while filtering out all non-matching words from the visualization.


If I go back to my data connection and left join my own, custom made Stop Words data set to it, I can easily filter out any of the commonly used words I do not want to see in my word cloud. Here, we can see that words like "the" which occurs 4,092 times throughout the book, is filtered out, along with other commonly used stop words like [and, in, a, his, of, said, he, to, etc.] while the newly reigning word featherweight champion of the book now clearly becomes "harry." This word cloud has the same ability to filter, search, and easily see the word occurrence groups.


Ok, great, I built an interactive word cloud. What about all those other questions I have? Building a word cloud dashboard would allow me to take advantage of the unique words and also the word sequencing that I have built into my text data through additional visualizations and dashboard actions. This is helpful because a word cloud is not typically the best data visualization to use if I want real insights from my data, so the dashboard below provides 3 additional views to the word cloud:

  1. A word bubble (Word Bubble! at bottom left) easily helps me get a sense of the quantity of each unique word in a given word occurrence group.
  2. A vertical bar chart (Words Used per Chapter at bottom middle) helps break down each chapter by the unique words contained within it.
  3. A horizontal bar chart (Most Used Words at bottom right) quickly shows words having the most to least occurrences.


And when these 3 additional views accompany the word cloud, I can now apply dashboard actions to click on different data points and answer questions like:

How often, per chapter, does the word Harry occur compared to all other words in the chapter? In fact, Harry appears throughout the book more than the total count of unique, relevant words in most of the chapters.


What chapters feature Ron, Hermione, or even the adorable little Dobby? If I click on Dobby, I'll see he is featured in chapter 2, chapter 10, and of course chapter 18 when (spoiler alert) "Master has given a sock... Master gave it to Dobby... Got a sock. Master threw it, and Dobby caught it, and Dobby - Dobby is freeeeeeeee."


What chapters feature certain creatures or events? Click any data point and take a look at the "Words Used per Chapter" chart to find out which chapters heavily feature certain words. I can even type a word in the "search for a particular word" filter to more clearly see which chapters feature words like "spider" (chapter 15) ...


...or which chapters are filled with "quidditch" action (chapters 7 and 10).


Very magical stuff, indeed! If you have a great example of a word cloud dashboard that you'd like to share or if you have any questions or feedback, feel free to comment below.

NFL Drive Analysis - Giants vs Lions

I figured I'd take the passive approach for a new blog idea and let my attention flow naturally to what's most interesting to me at the moment. With my time (and cash) vested in an office Fantasy Football league, my mind has been fixed on NFL data as of late, despite all the upstanding citizens the NFL employs.

Assault, DUIs, performance enhancing substances, shootings and murder aside, the NFL kicked off its new season last weekend. That means my fandom experience is back in full gear. Sometimes, it's great, but most of the time it's hard being a New York Giants fan. I'm referring to the NY Giants football team from the East Division of the National Football Conference (NFC) division in the National Football League (NFL). I say it can be great because we've managed to pull off (basically steal) 2 Super Bowls in the last 10 years, but most of the time it's really hard due to games like the one I begrudgingly sat through last Monday.

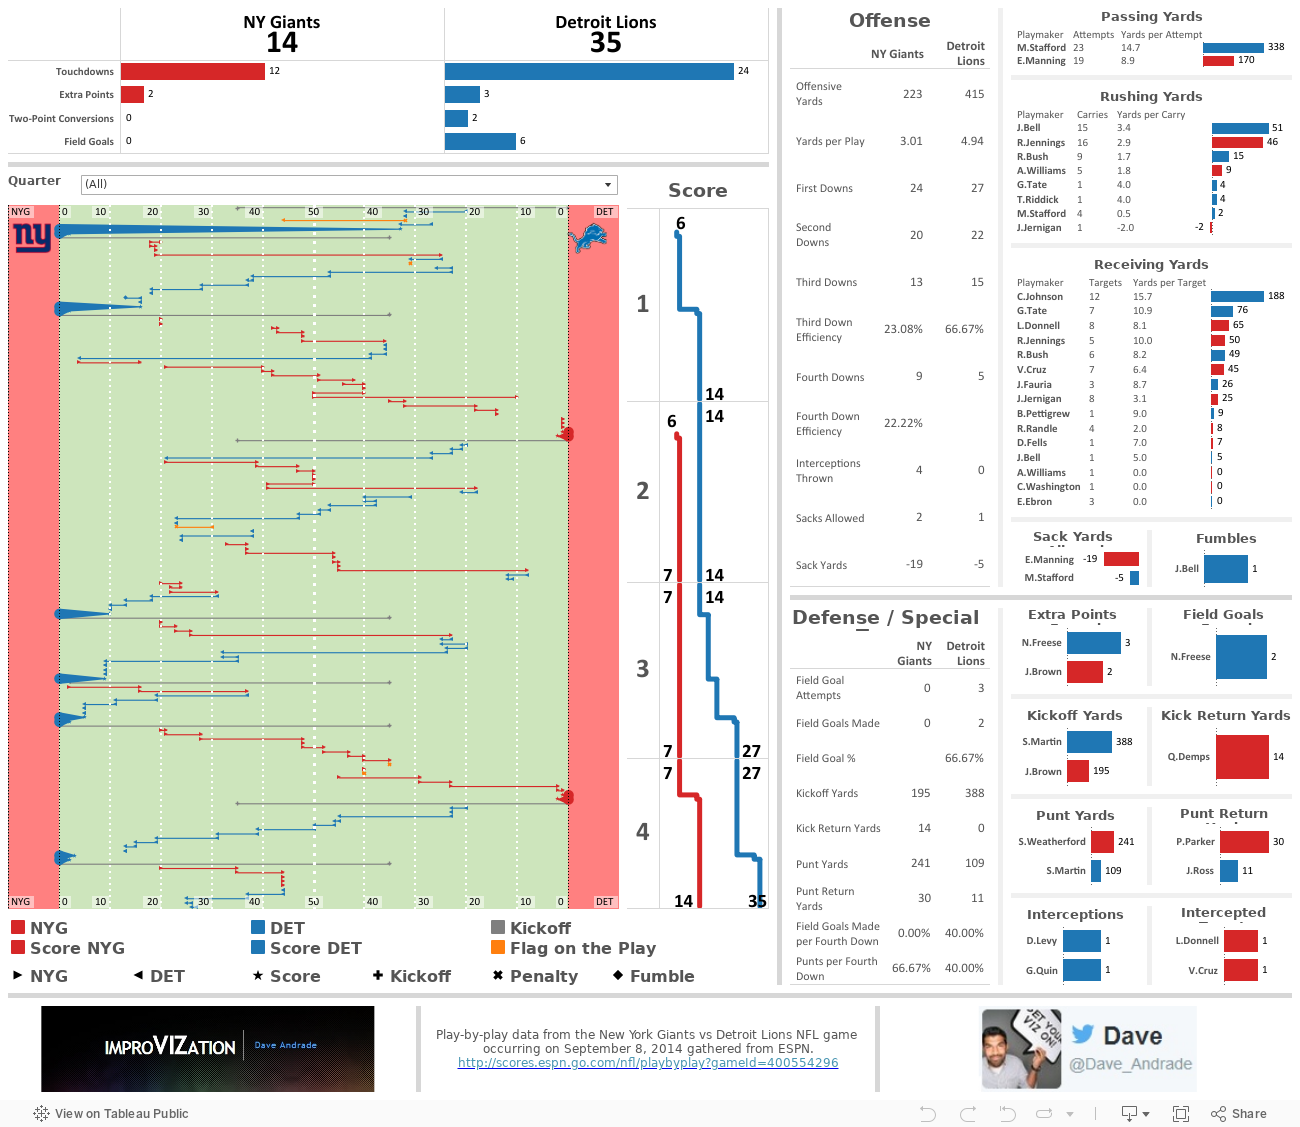
I digress, last Monday, while watching my beloved NY Giants [compete?] against the Detroit Lions, I saw something that I just had to try and recreate in Tableau. I set my intention to recreate a drive chart by using the play-by-play data from the game.

The play-by-play is a linear view of the game, ordered by the quarter (4 total) and time (15 minutes per quarter), and detailed with the down, 1st down yards remaining, starting field position, and play detail (players involved, play activity (pass/rush/etc), and other important details (touchdowns/penalties/etc). Here's an example from ESPN:

A very helpful view to visualize the play-by-play detail of a game is the drive chart. The drive chart shows where, on the field, the team with possession starts out and how far they make it down the field either before scoring or turning the ball over. Below is a drive chart, also from ESPN, for the 1st quarter of the game. As you can see, the Detroit Lions (in blue) dominated with 2 scoring drives while the NY Giants (in grey) were forced to turn the ball over through punting on both drives. Now, please, use your vivid imagination to picture me losing my patience and my interest in the game at this point.


I grabbed the ESPN play-by-play data and dumped it in Excel. I created two columns, one for the down detail and another for the play detail. The data looked like this after I cleaned it up a bit:


Now for the fun part! I took the down detail and play detail, extrapolated certain parts of it to new columns for a more database-friendly view of the data, and created some additional columns not provided by the play-by-play data to help me achieve what I needed to create a drive chart in Tableau. The most important new field I had to create is the "Path" field (column D). This field allows Tableau to assign the data with a start and end point for the same field. For example, rows 2 and 3 provide the same start (columns G and H) and end (columns I and J) field positions but are broken out into two separate rows that Tableau can use to reference. The starting field position (NYG 35 yard line) is assigned the path of "0" and the end field position (DET 0 yard line) is assigned the path of "1" in Tableau.


Here's where the magic happens. I have to somehow translate the available data into a start and end position on an X axis for Tableau. Tableau needs to know which side of the field belongs to NY vs Detroit, as well as what happens when the starting field position is on the NY or Detroit side. This is where my fancy calculated field comes into play. It helps Tableau identify which columns to use and what to do with the values when the path is 0 for the starting point on the field, and the same for a path of 1 for the end point on the field. I sat down with a pencil and paper to figure this one out.


Needless to say, I was pleased with the result because it factored in the full 120 yard size of the field, with each end zone having 10 yards, and it allowed me to recreate a football field in Tableau using a bunch of reference lines and bands with colors, line sizes, and shapes to indicate different activities of the play-by-play!


Now that I had that item tackled, no pun intended, I created many more calculations based on the activity/play detail/etc. Adding these proved to be difficult, especially when trying to tie my numbers with those reported by ESPN. You may see some slight differences here and there, but the general idea remains the same - the Giants got their asses handed to them by Matt Stafford and Megatron. I also added a filter across the entire dashboard for quarter (mostly to filter on the second quarter and give myself some relief that the Giants at least dominated in score, though not even offensive yards...) and used dashboard actions to make every data point interactive across all applicable charts. Here's the final product... enjoy!

World Cup 2014 Brazil GOOOALS!!!

 Well, that was fun! Anyone else feel like they're in World Cup withdrawal?

I have just the thing for you...

I was fortunate enough to catch almost every game played in the World Cup, my favorite of all sporting events. As you can tell, I'm a sucker for all the facts, stats, data, odds, visuals, blogs, coverage, memes, and general hype around this year's World Cup. There are so many fantastic websites out there that produce hours of entertainment for me. FIFA itself provided some really cool content and statistics on their website and app, while sources like The Guardian produced a flurry of facts and stats. After creating a data set that detailed each goal scored in World Cup 2014 (sans overtime penalty kicks), I decided to use Tableau v8.2's story points to help organize and visualize some of the fun facts provided by The Guardian. Check it out:

#QuantifiedSelf - I Am What I Listen To

 Hello, my name is Dave, and I'm a music addict.

In 2007, I started tracking the music I listened to through a website called Last.fm. Back then, I typically listened to music through iTunes. However, iTunes didn't provide a good historic view of all the songs I've listened to. My eclectic, offbeat taste in music combined with my inner data nerd made Last.fm a great resource to me. Over the years, I've used Last.fm to track much of the music I've listened to through my iTunes desktop application, my iPod, and now through my Spotify desktop application. The only downside is that Last.fm doesn't track music I listen to on my iPhone's Spotify app, which I tend to use quite a bit.

The next step, after tracking and storing the data, is to visualize it. And what better time to create a music data viz than #QuantifiedSelf month?! I took my data, flowed it through Tableau and came up with a visualization that encourages the exploration of my music listening habits.

A few interesting insights to point out from the 1 year look-back period shown above:

  • I typically have project huddles during the morning and try to reserve afternoons for development, which can be clearly seen in the "typical week, in songs played" heat map
  • My peak time of day to listen to music is around 3pm on Wednesday, and when clicking on this time I see I listen to a lot of punk rock, which typically has shorter song lengths, thus the higher song play count at that time
  • You can see I typically don't start listening to music until 9am, but on 3/28 I had some early morning work to do where I listened to a lot of Math Rock, a genre of asymmetric time signatures and complex rhythms, to stimulate my brain and keep me going early in the morning.
  • If you switch over to the "mood" filter, you can see I'm pretty well balanced between upbeat and relaxed music and that I've been listening to a lot more "chill" music recently. If you check out some of the chillwave bands I've been listening to, you'll see their music is perfect for warm weather - I'm ready for Summer!

FEASTING IN PHOENIX

Welcome to 2014! I love the idea of a 'new year'. It gives me a means to start over; to leave my troubles in the past; to look forward to new beginnings; to create resolutions; to feel recharged and continue working hard to achieve my goals. A new year also gives me an opportunity to honor old traditions while finding new ways to make them fun and exciting each year. As a child, I spent each new year with my parents and siblings, watching the ball drop on TV and counting down with all the freezing people in Times Square from the comfort of my home. As a 'tween', I spent each new year with my parents and maybe even had a friend over for the night, while my older siblings were out at parties. As a teenager, I started going to parties. And now, in my twenties, the plan has typically been to spend the new year in Florida with my parents, siblings and their kids. Everything's full circle, right?

To ring in 2014, my wife and I managed to escape the cold New England weather and head some place warm - Phoenix, AZ.  Definitely not my first pick of places to spend the new year, but my brother and sister-in-law live there and I'm an easy sell when it comes to them. Not only would we be going to a killer New Years Eve party, but we'd be feasting at all their favorite restaurants. My wife and I are big into dining out, cooking at home, and pretty much anything else related to the creation and consumption of food. Needless to say, we were very excited about the prospect of a Phoenix vacation/culinary adventure.

Upon our arrival on December 31st, my brother picked us up from the airport. We took a 10am flight out of Boston and arrived in Phoenix around 2pm, which means we skipped lunch! What to do? Oh yeah, the west coast has something we don't... In-N-Out Burger!!! The perfect guilty pleasure to satisfy our serious hunger. Now, as much as I love In-N-Out, I always get stared at like a crazy person when I say, "I like 5 Guys more... In-N-Out tastes like a glorified McDonald's burger." Yes, 5 Guys does not make "animal style" burgers, but I think they taste more like a hot-off-the-grill backyard burger than a hot-off-the-production-line fast food burger. It was a good thing I only ordered a double-double animal style with well-done fries and a Coke because later that night, we feasted on some Federal Pizza pizzas before heading out to the new years party at Hotel Valley Ho.

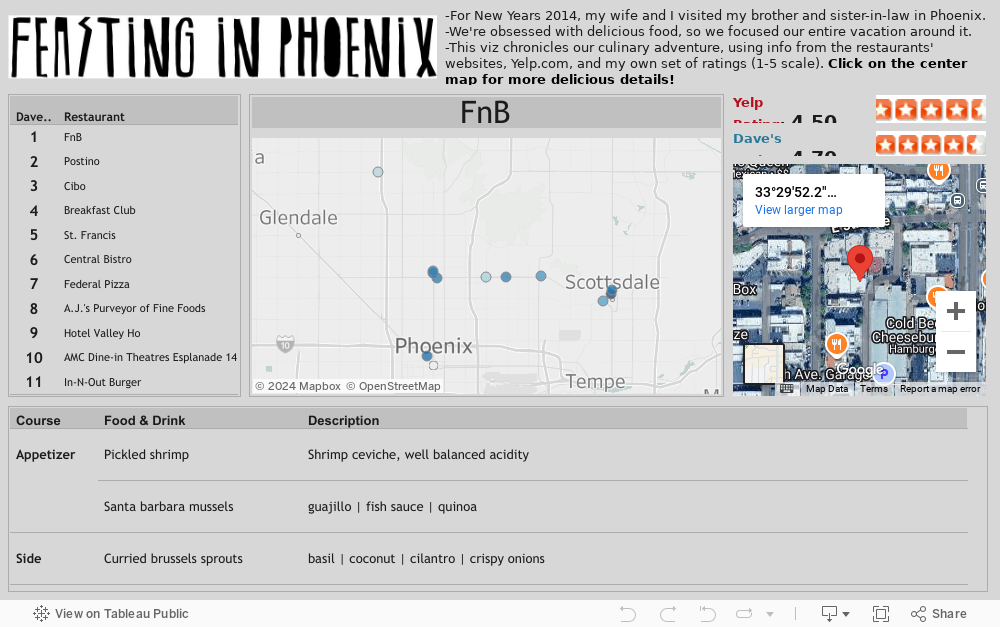
Now, to be honest, after this point the vacation was pretty much a blur and that's exactly how I like my vacations to be, but I did manage to document every place I had a meal. The idea was that after I returned home, I'd feel more alive than ever knowing I'd eaten all that delicious food and lived to blog about it. So, after I recovered from my food coma, I compiled it all into a spreadsheet and flowed the data through Tableau. The idea was to create a 'food map' that detailed and ranked all the places I had a meal at.

Click on the viz below and you'll be able to vicariously experience my culinary adventure. I only wish Tableau would add in a way to smell the data... maybe in version 10!


Now for the hail of bullets:

  • My favorite restaurant in Phoenix is FnB. Everything from the food to the service to the atmosphere was great.
  • My favorite meal in Phoenix was at Central Bistro, where I had chicken and waffles, along with tons of other delicious sides.
  • I think I ranked Postino very high because I really enjoy dinners that consist of many small meals, similar to tapas, so the 7 different types of bruschetta really hit the spot
  • Cibo had a fantastic outdoor space to eat, with a raging fire and a very cool jazz trio. Great Italian  food!
  • The brunch I had at The Breakfast Club narrowly missed making it to my favorite meal of the trip. Huevos con masa are to die for.
  • And my last point has to be the movie experience I had at the AMC Dine-In Theatres. This place was ridiculous! Reclining leather couches with food and drink service at the push of a button. And I thought 3D IMAX was cool...

Thanks for reading!

Credit to Ben Jones at DataRemixed. I was thinking about using wms for my Tableau mapping, but I thought I'd try Ben's neat trick to dynamically display a Google  map satellite image through dashboard actions - http://dataremixed.com/2013/06/how-to-embed-a-google-map-in-tableau/

BOSTON SNOW INDICATOR

It's December. As a New Englander, I look forward to the holidays and the cold, snowy weather that comes with them. With all the buzz about Santa Claus and our "Dreaming of a white Christmas", I started looking into data sets containing historical snow accumulation in the US. The idea was to come up with something like this or, even better, like this, but it seems I was beat to the punch. I decided to limit scope to Boston snow data.

After doing so, the ol' Boston Snow Indicator popped up in my head. The reason being that, in a previous life, I worked as an investment advisor and heard all sorts of speculative ways to forecast market performance. As a finance professional, I was in a rat race to beat the market in any [legal] way possible because any sort of competitive edge may result in more clients investing with me. More clients means more money, more money means more happiness, more happiness means... you get the point? I was young. By now you may have noticed this profession never panned out for me and I've redirected myself to a much less heinous professional track. I digress.

What the Boston Snow Indicator is, according to the definition on Investopedia.com, "A market theory that states that a white Christmas in Boston will result in rising stock prices for the following year. For example, in Christmas of 1995, Boston received snow and the following year, the S&P 500 increased by more than 20%." Essentially, if it snows a bunch in December, especially on Christmas, we're going to have a bullish year, so dump your money (and your clients money) in the market!

In my search for any sort of data around Boston snow accumulation and market index performance over time, I stumbled upon 2 websites that would give me a good start. I ended up combining the data from the two websites into one file, plugging it into Tableau, my weapon of choice for data visualization.

I have just a few basic components I want to work with, then a couple other parameters and calculated fields I created to make things interesting:
Dimensions: Year
Measures: Dow Jones Industrial Average (DJIA) percent gain or loss, NASDAQ percent gain or loss, S&P percent gain or loss, Snowfall

I first decided to chart out snowfall over time, using the lollipop chart method to spice up the viz with snowflakes. Then I plotted out the indeces over time to compare and see if any trends clearly popped out. Nothing major, so next I decided to create the scatterplot, box plot, and heat map to get a better feel for distribution. I felt like I had a good enough story to tell at that point, so I threw it all on a dashboard and started playing with the custom parameters, custom coloring, and quick filters to come up with the following:

Now, as Investopedia.com explains it, "As you may have guessed, there is no logical correlation between whether there is snow in Boston on Christmas and the performance of the stock market. Any incidence of a white Christmas in Boston and bullish market performance in the following year are purely coincidental. This may be why this indicator is also referred to as the "BS indicator".

I think I accomplished what I set out to do - come up with a cool way to take 2 very boring data sets, blend them together, and visualize them in a way that helps answer a question.

Oh, and the super neat little font I used in the blog title was created using dafont.com