
Last week, a co-worker asked if I could help her out with a Tableau table calculation. Her goal was to come up with a year-over-year (YoY) percent difference of the 4 week moving average for some key metrics in her data set. Tableau easily allowed her to find the key components individually, but she was having difficulty combining the YoY %Diff with the 4 week moving average. I'd like to share how I thought through the problem and worked it out with table calcs.
First, it's important to understand what table calculations are... from Tableau's website:
"A table calculation is a transformation you apply to the values in a visualization. Table calculations are a special type of calculated field that computes on the local data in Tableau. They are calculated based on what is currently in the visualization and do not consider any measures or dimensions that are filtered out of the visualization."
The "table" refers to the data table I create in Tableau by pulling in dimensions and measures into the rows and columns shelves. The physical data table is all that I have to work with, so any values I'd like to use for a table calculation better be represented somewhere on my table! One of the neat things about this is that data can be aggregated or calculated prior to being populated in the table, and then that pre-aggregated or calculated data can be used for additional calculations. Some of the most common applications of table calculations include percent differences, running totals, weighted averages, etc.
Knowing I need all my data laid out on the table in order to use a table calc, I start with populating my data table with something like sales (measure) by date (dimension). For the purpose of this exercise, the date dimension contains dates from every Sunday of the week.
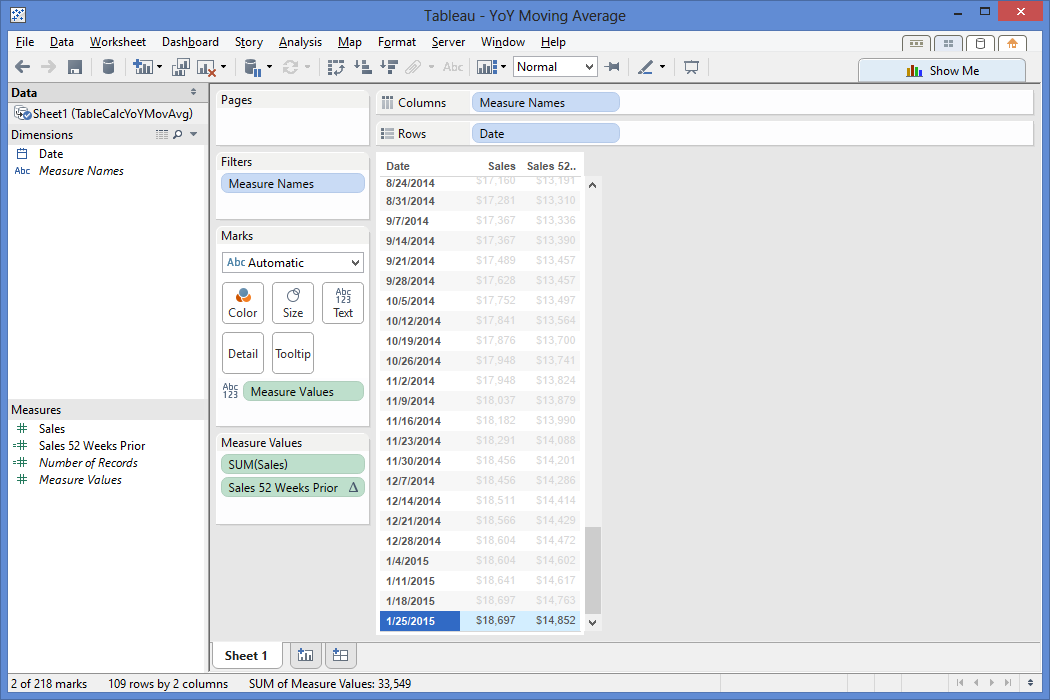
Essentially, on my data table, what I want to start with are the weekly sales figures for each Sunday. I drag my date dimension onto the rows shelf as a discrete, exact date. I then drag my sales measure onto the text mark.


I double click my "Sales 52 Weeks Prior" pill in the measures shelf to add it to my data table, then check if my 1/26/14 value is now showing as the 1/25/15 sales value.
It checks out! The next calculation I need is to find the 4 week moving average. I right click on the Sales pill in my Measure Values and create a table calculation. I select the Moving Calculation, summarize values using the average, moving down along the table since my dates are sorted ascending, and then look 3 values back from the current value.

One thing to point out here is that I could click "Perform a secondary calculation on the result" as seen in the below image but Tableau does not provide an option for a custom number of values to look back on, which is a big part of why I'm writing this post! I only have the previous, next, first, and last values as an option, and I need to specifically look 52 values back, so let me click out of this option and go back to the table calc above.

If I click the "Customize..." button, I can check out Tableau's automatically generated calculation based on my selections. This calculation takes the Window Average of my sales, starting 3 periods back from a given value, to the given value. I rename this calculation as the "Sales 4 Week Moving Average" to save it as a new calculated field in my measures shelf because I'll be using it again.

When I click OK, this calculation will now replace the sum(Sales) on my chart, so I go ahead and add sum(Sales) back to the table for reference. Does the moving average calculation average out the current plus last 3 weeks of sales data for a 4 week moving average? Yup!

So now what do I do? Well, let me start with what I have... I have my weekly sales, my sales from a year back, and my 4 week moving average. I now need to find a way to get my 4 week moving average from a year back.
I have an excellent head start for this, because I not only got my 4 week moving average calc working, but I also have the lookup logic to get a value from 52 weeks back. What I need to do is create a new calculation that combines the "Sales 4 Week Moving Average" logic [WINDOW_AVG(SUM([Sales]), -3, 0)] with my "Sales 52 Weeks Prior" logic [LOOKUP(zn(sum([Sales])),-52)].
This is precisely why I replace the sum([Sales]) logic in my 1 year lookback [LOOKUP(zn(sum([Sales])),-52)] with the 4 week moving average logic [WINDOW_AVG(SUM([Sales]), -3, 0)].

I add my new calculated measure "Sales 52 Weeks Prior 4 Week Moving Average" to the data table by double clicking its pill in the measures shelf. Does this show the 4 week moving average from 1 year ago on the current row? It sure does!

Now that I have the current 4 week moving average and the 4 week moving average from 52 weeks ago, I can create a calculation that takes the ( (current 4 week average) - (4 week average from 52 weeks ago) ) / (4 week average from 52 weeks ago) to find my year-over-year 4 week moving average.
( WINDOW_AVG(SUM([Sales]), -3, 0) - LOOKUP(zn(WINDOW_AVG(SUM([Sales]), -3, 0)),-52) )
/ LOOKUP(zn(WINDOW_AVG(SUM([Sales]), -3, 0)),-52)

I add this to the data table to check if works...

It works! I have just created a YoY %Diff using 4 week moving averages to show that my 1/25/15 4 week moving average is 26.86% more than the 4 week moving average from 52 weeks back! If I play around with the Show Me options, I can chart my YoY 4 week moving average against the 4 week moving average of sales as a line graph, or whatever type of visualization will help the end users make data-driven decisions.

A few gems for you to note that played an instrumental role in my ability to work through this table calc problem in Tableau:
- Build out your base table first using dimensions and measures needed for analysis
- Maintain a level of granularity needed for the table calcs i.e. having weekly data for a 4 week moving average calculation
- Try to get any calculations needed on the given row it will impact i.e. bringing the 4 week moving sales average from 1/26/14 (52 weeks ago) to the row that displays 1/25/15 data
- Create basic calculations first, then start piecing them together to achieve what you need i.e. embedding the 4 week moving average calc into the YoY calc
- Be creative but think practically